
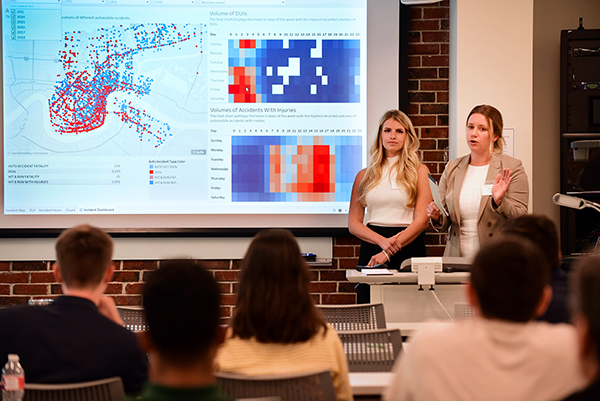
Master of Business Analytics students Peyton Thompson, left, and Natalie Philips present their visualization of New Orleans Police Department data at October’s Tulane Business Analytics Colloquium.
For the past seven years, the New Orleans Police Department has published the data it collects when residents call 911 with a police emergency, but with more than 750,000 different data points in a given month — detailing everything from the time the call was received to the incident’s ultimate resolution — making sense of it all can be a challenge.
To help make the information more accessible to the public, the NOPD recently turned to the Freeman School and students in the newly launched Master of Business Analytics (MANA) program.
Working with the NOPD’s Analytics Unit, the students created visualizations of the data that could be incorporated into the department’s website. Visualization refers to presenting data in a graphic format to help users better understand the information and gain insights that might not be apparent in the raw data.
“We think it’s a very good way not only to help the students learn how to do data visualization, but also to give back to the community,” said Ricky Tan, assistant professor of management science and instructor in the course Business Analytics Projects.

Assistant Professor of Management Science Ricky Tan, left, and New Orleans Police Department Director of Analytics Ben orwitz. In partnership with Horwitz, Tan had the students in his Business Analytics Projects class create data visualization dashboards using the police department’s calls for service data.
Using Tableau, a powerful software, the student teams created dashboards that enable users to sort the calls by type and display them on a map. One team combined the calls for service with geographic information system (GIS) data, enabling users to get a more granular picture of crime in their neighborhoods than ZIP codes alone would offer. Another team isolated crimes occurring near Mardi Gras parade routes, a data view that highlights how safe Carnival season tends to be. The students also analyzed the data based on their visualizations and made strategic recommendations, such as focusing additional resources on areas with slow response times.
“Those insights don’t automatically pop up,” said Xianjun Geng, professor of management science and director of the Master of
Business Analytics program. “They’re usually hidden. The MANA program gives students the ability to sift through the data and bring insights like those to the surface, which are skills increasingly in demand by companies around the world.”
In September, the students presented their work to Ben Horwitz, director of analytics with the New Orleans Police Department.
“We know that releasing the data is really important, but the next step is making it accessible to the public,” Horwitz said. “That’s one of the reasons we’re partnering with Tulane, because there are all sorts of questions that are important to the public that we can address by making these data sets easier to understand.”
Horwitz said he plans to work with Tan to make the students’ visualizations available on the department’s data site, and he hopes to work with MANA students on additional projects in the future.
“Students and interns can help us tackle areas of work that maybe we don’t have time or the capacity to do and apply methodologies that we may not have the expertise in,” Horwitz said. “By partnering with a university like Tulane, we get access to that.”